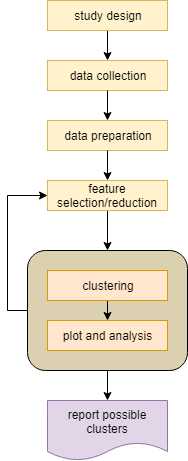
Unsupervised learning
“Unsupervised learning is a type of machine learning algorithm used to draw inferences from datasets consisting of input data without labeled responses. The most common unsupervised learning method is cluster analysis, which is used for exploratory data analysis to find hidden patterns or grouping in data.” read more…
Dimensionality reduction
It is hard to interpret the data in the feature space (M dimensions). The first exploration step into data is to reduce the dimensionality to 2 dimensions and plot the dimensions in x-y coordinates which are human readable.
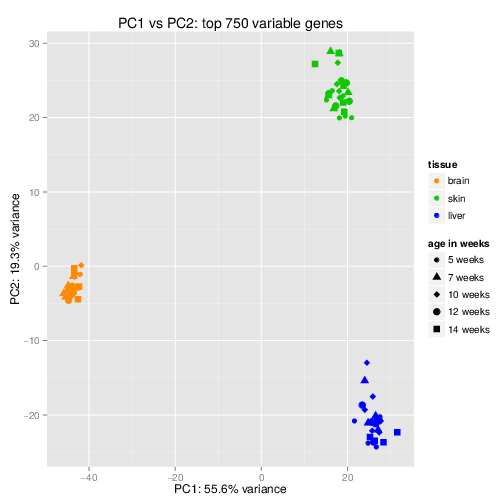
- Principle Component Analysis (PCA) is the most commonly used dimensionality reduction method. Each principle component is a linear combination of \(weights.features\). Weights are adjusted to capture the most variability across samples. The components are uncorrelated and can be used as features for further clustering or classification. Common practice is to plot principle components and color the samples by different features to see how the samples are separating. You should keep in mind that while PCA shows the variability in the data, it is not always meaningful and might be showing noise or batch errors.
- Singular-value decomposition (SVD) calculates the diagonal matrix S on the data matrix A :
where M is the feature size (columns) and N is the sample size (rows). Read more here.
Clustering
Clustering algorithms try to divide the data samples based on some sort of similarity into different clusters. An example is to cluster single cell gene expression data to find tissue types.
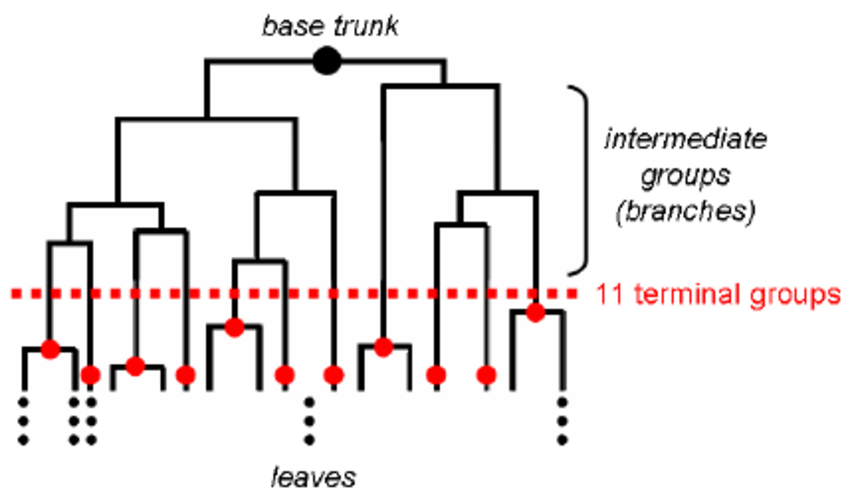
- Hierarchical (agglermorative) clustering is the most basic clustering algorithm. The samples are put in its own clusters and then iteratively the most similar clusters are combined to create super-clusters. This can be done bottom up or downwards to form a dendrogram which you can cut at any level to obtain different number of clusters. Hierarchical clustering is usually shown as a heatmap.
- K-means is a method to cluster the samples into K distributions with different means. The algorithm starts by choosing K random points as means in the feature space and assigns samples to a cluster with the closest mean (by some similarity measure). The means are iteratively moved to best fit the samples until no further improvement are made. This method is not deterministic and depends on the initial random guesses. Bad guesses will result in poor clustering.
- X-means is a general K-means clustering algorithm that tries different K values to find the K that best represents the data.
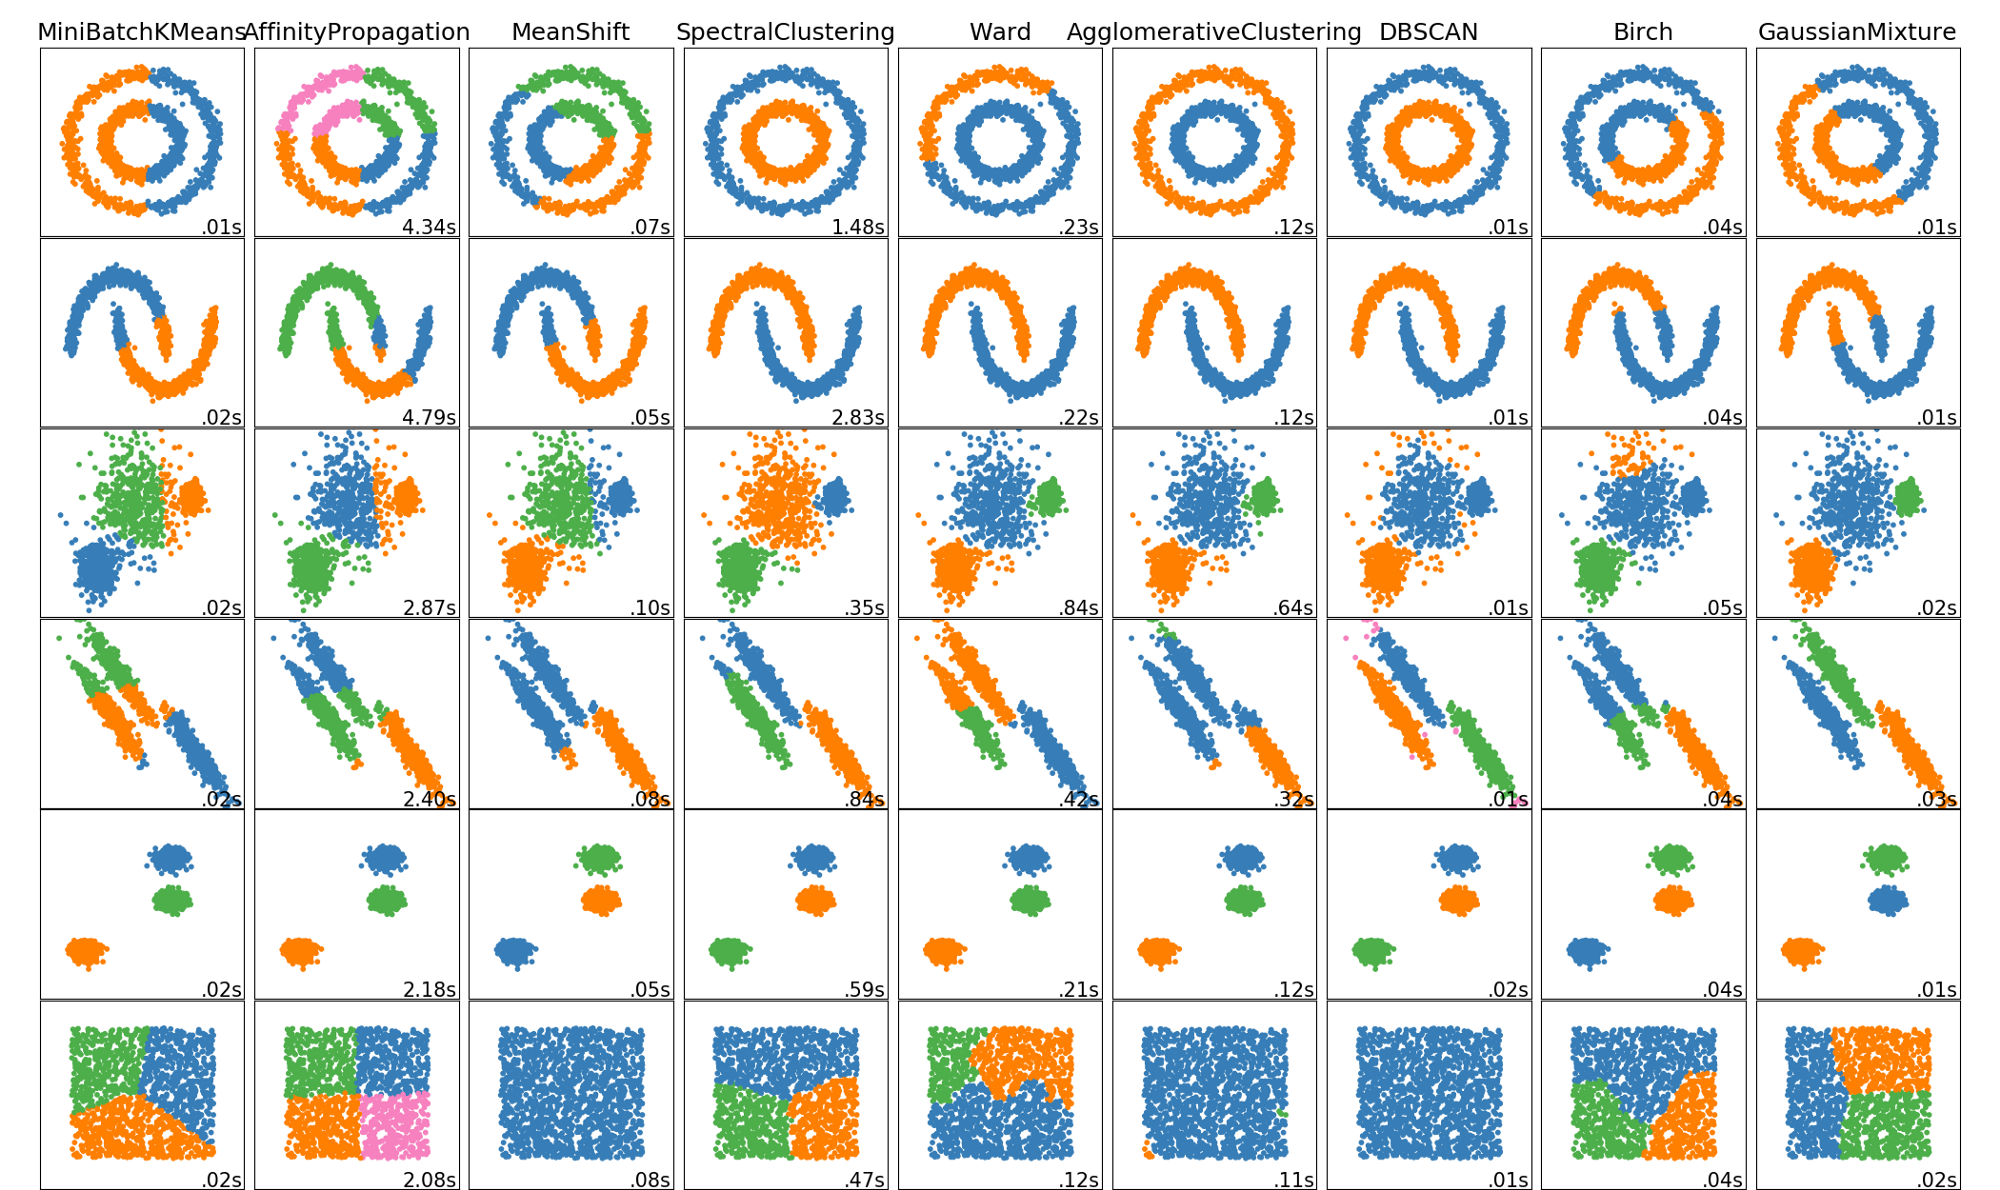
The following image shows different clustering algorithm run on different data (2 dimensions).
Note that in all these clustering methods we talked about similarity. Similarity can be defined differently. Euclidean distance is the most common measure which is simply measuring the straight line distance between the two samples in the feature space. For a detailed comparison read this article:
Keep in mind that any data clusters. Clusters obtained by any method are a way to explore the data. You can measure the fitness of the clustering by measuring the intra-clusters similarity vs. the in-between cluster dissimilarity. Commonly used measure are Silhouette coefficient and the Davies–Bouldin index.